Experiment 2.10.1: Delete only red without "desaturated" label
This is a re-run of Ex 2.10 with more mature tooling. See the earlier notebook for discussion.
from __future__ import annotations

nbid = '2.10.1'  # ID for tagging assets
nbname = 'Ablate red (only), 5D, fewer labels'
experiment_name = f'Ex {nbid}: {nbname}'
project = 'ex-preppy'
# Basic setup: Logging, Experiment (Modal)
import logging

import modal

from infra.requirements import uv_freeze, project_packages
from utils.logging import SimpleLoggingConfig
from ex_color.vis import NbViz

logging_config = (
    SimpleLoggingConfig()
    .info('notebook', 'utils', 'mini', 'ex_color')
    .error('matplotlib.axes')  # Silence warnings about set_aspect
)
logging_config.apply()

# This is the logger for this notebook
log = logging.getLogger(f'notebook.{nbid}')

image = (
    modal.Image.debian_slim()
    .pip_install(*uv_freeze(all_groups=True, not_groups='dev'))
    .add_local_python_source(*project_packages())
)
volume = modal.Volume.from_name(f'{project}-{nbid}', create_if_missing=True, version=2)
app = modal.App(name=f'{project}-{nbid}', image=image, volumes={'/data': volume})

viz = NbViz(nbid)
None  # prevent auto-display of this cell
Model parameters
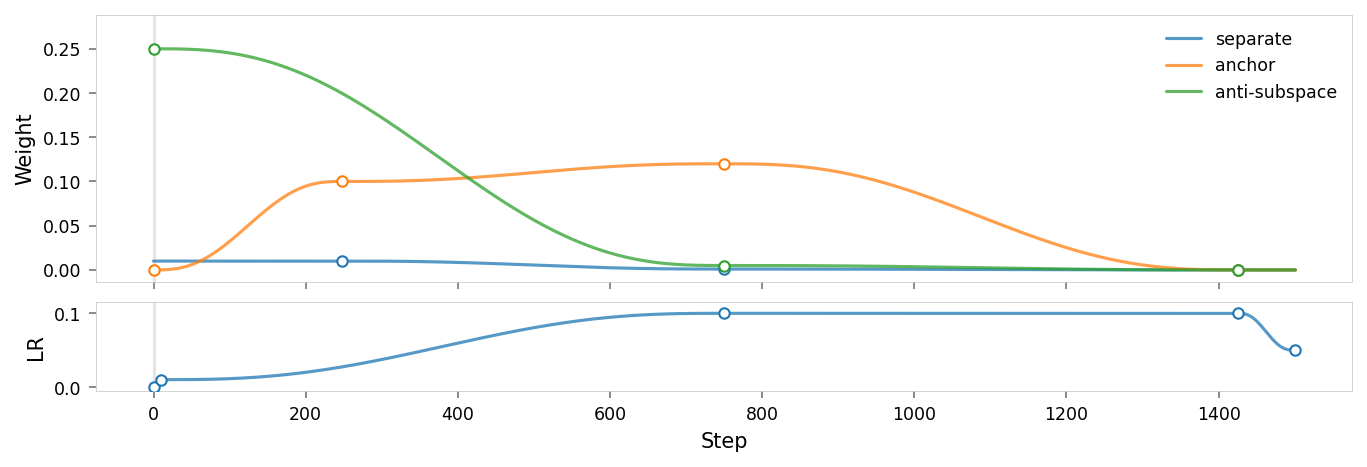
Like Ex 2.9, we use the following regularizers:
- Anchor: pins
redto $(1,0,0,0,0)$ (5D) - AxisAlignedSubspace: repels everything from dimension $1$ (with varying weight, see schedule)
- Separate: angular repulsion to reduce global clumping (applied within each batch)
Since we're isolating red, we have 5D latent embeddings and two nonlinear activation functions in the encoder and decoder, to allow the latent space to be warped more.
But unlike 2.9:
- Anti-anchor: has been removed, relying on anti-subspace to keep other concepts clear of the dimension to be ablated.
- Unitarity: is present in this list, but we'll do a run without it too.
import torch

from ex_color.loss import AngularAnchor, AxisAlignedSubspace, Separate, RegularizerConfig

K = 5  # bottleneck dimensionality
N = 2  # number of nonlinear layers
RED = (1, 0, 0, 0, 0)
BATCH_SIZE = 64
CUBE_SUBDIVISIONS = 8
NUM_RUNS = 60  # to probe seed sensitivity
RUN_SEEDS = [i for i in range(NUM_RUNS)]

reg_separate = RegularizerConfig(
    name='separate',
    compute_loss_term=Separate(power=100.0, shift=True),
    label_affinities=None,
    layer_affinities=['bottleneck'],
)
reg_anchor = RegularizerConfig(
    name='anchor',
    compute_loss_term=AngularAnchor(torch.tensor(RED, dtype=torch.float32)),
    label_affinities={'red': 1.0},
    layer_affinities=['bottleneck'],
    phase=('train', 'validate'),
)
reg_anti_subspace = RegularizerConfig(
    name='anti-subspace',
    compute_loss_term=AxisAlignedSubspace((0,), invert=True),
    label_affinities=None,
    layer_affinities=['bottleneck'],
)
from mini.temporal.dopesheet import Dopesheet

dopesheet = Dopesheet.from_csv(f'./ex-{nbid}-dopesheet.csv')
viz.tab_dopesheet(dopesheet)
viz.plot_dopesheet(dopesheet)
from torch.utils.data import DataLoader, RandomSampler

from ex_color.data.cube_dataset import prep_color_dataset, redness, stochastic_labels, exact_labels


def prep_train_data(training_subs: int, *, batch_size: int) -> DataLoader:
    dataset = prep_color_dataset(
        training_subs,
        sample_at='cell-corners',
        red=lambda c: redness(c) ** 8 * 0.08,
    )
    return DataLoader(
        dataset,
        batch_size=batch_size,
        num_workers=4,
        sampler=RandomSampler(dataset, num_samples=len(dataset), replacement=True),
        collate_fn=stochastic_labels,
    )


def prep_val_data(training_subs: int, *, batch_size: int) -> DataLoader:
    dataset = prep_color_dataset(
        training_subs,
        sample_at='cell-centers',
        red=lambda c: redness(c) == 1,
    )
    return DataLoader(
        dataset,
        batch_size=batch_size,
        num_workers=2,
        collate_fn=exact_labels,
    )
from typing import Callable

import torch
import wandb

from ex_color.model import CNColorMLP
from ex_color.seed import set_deterministic_mode
from ex_color.workflow import train_model
from ex_color.evaluation import Result
from utils.time import hour


@app.function(
    cpu=1,
    max_containers=20,
    timeout=1 * hour,
    env={'WANDB_API_KEY': wandb.Api().api_key or ''},
)
async def train(
    dopesheet: Dopesheet,
    regularizers: list[RegularizerConfig],
    *,
    seed: int,
    score_fn: Callable[[CNColorMLP], float],
):
    """Train the model with the given dopesheet and variant."""
    logging_config.apply()

    if seed is not None:
        set_deterministic_mode(seed)

    train_loader = prep_train_data(CUBE_SUBDIVISIONS, batch_size=BATCH_SIZE)
    val_loader = prep_val_data(CUBE_SUBDIVISIONS, batch_size=BATCH_SIZE)
    model = CNColorMLP(K, n_nonlinear=N)
    res = train_model(
        model,
        dopesheet,
        regularizers,
        train_loader,
        val_loader,
        experiment_name=experiment_name,
        project=project,
        hparams={'seed': seed},
    )

    score = score_fn(res.model)
    key = f'model-{res.id_}.pt'
    torch.save(res.model.state_dict(), f'/data/{key}')
    return Result(seed, key, res.url, res.summary, score)
from ex_color.evaluation import EvaluationPlan, ScoreByHSVSimilarity
from ex_color.surgery import ablate

ablation_plan = EvaluationPlan(
    {'ablated'},
    lambda m: ablate(m, 'bottleneck', [0]),
    [],
)

score_fn = ScoreByHSVSimilarity(ablation_plan, (0.0, 1.0, 1.0), power=3.0, cube_subdivisions=CUBE_SUBDIVISIONS)
import asyncio

# Reload dopesheet: makes tweaking params during development easier
dopesheet = Dopesheet.from_csv(f'./ex-{nbid}-dopesheet.csv')
regularizers = [reg_separate, reg_anchor, reg_anti_subspace]


async def sweep():
    logging_config.apply()
    workers = [train.remote.aio(dopesheet, regularizers, seed=seed, score_fn=score_fn) for seed in RUN_SEEDS]
    return await asyncio.gather(*workers)


with app.run():
    results = await sweep()
from IPython.display import display
from ex_color.evaluation import results_to_dataframe

runs_df = results_to_dataframe(results)
# Show min, max, mean, stddev of each column
log.info(f'Summary statistics for all {len(runs_df)} runs:')
display(runs_df.describe().loc[['min', 'max', 'mean', 'std']].style.format(precision=4))

print('Correlation of reconstruction error vs. similarity to anchor')
viz.plot_boxplot(runs_df['score'], ylabel='', xlim=(None, 1), tags=('score',))

print('Reconstruction loss')
viz.plot_boxplot(runs_df['val_recon'], ylabel='', log_scale=True, tags=('val_recon',))

print('Anchor loss')
viz.plot_boxplot(runs_df['val_anchor'], ylabel='', log_scale=True, tags=('val_anchor',))
I 1009.3 no.2.10.1:Summary statistics for all 60 runs:
| seed | score | _runtime | labels/n/red | labels/n_total | val_loss | val_anchor | labels/n/_any | val_recon | |
|---|---|---|---|---|---|---|---|---|---|
| min | 0.0000 | 0.0376 | 48.0783 | 68.0000 | 96064.0000 | 0.0000 | 0.0000 | 68.0000 | 0.0000 |
| max | 59.0000 | 0.9769 | 246.7323 | 98.0000 | 96064.0000 | 0.0004 | 0.0465 | 98.0000 | 0.0004 |
| mean | 29.5000 | 0.8503 | 79.2997 | 83.6167 | 96064.0000 | 0.0000 | 0.0014 | 83.6167 | 0.0000 |
| std | 17.4642 | 0.1413 | 32.3485 | 8.0087 | 0.0000 | 0.0001 | 0.0059 | 8.0087 | 0.0001 |
Correlation of reconstruction error vs. similarity to anchor

Reconstruction loss

Anchor loss

Select the best runs from the Pareto front of non-dominated runs, optimizing for both validation loss and score.
from ex_color.evaluation import pareto_front

non_dominated = pareto_front(runs_df, minimize=['val_recon', 'val_anchor'], maximize=['score'])
log.info(f'Best of {len(non_dominated)} non-dominated runs (Pareto front):')
display(non_dominated.sort_values(by='score', ascending=False).head(5).style.format(precision=4, hyperlinks='html'))
I 324.1 no.2.10.1:Best of 9 non-dominated runs (Pareto front):
| seed | wandb url | score | _runtime | labels/n/red | labels/n_total | val_loss | val_anchor | labels/n/_any | val_recon | |
|---|---|---|---|---|---|---|---|---|---|---|
| 52 | 52 | https://wandb.ai/z0r/ex-preppy/runs/9wyfn37w | 0.9769 | 64.6405 | 76 | 96064 | 0.0000 | 0.0010 | 76 | 0.0000 |
| 9 | 9 | https://wandb.ai/z0r/ex-preppy/runs/3qsan94p | 0.9758 | 125.9621 | 94 | 96064 | 0.0000 | 0.0001 | 94 | 0.0000 |
| 30 | 30 | https://wandb.ai/z0r/ex-preppy/runs/k6q5appb | 0.9594 | 50.8907 | 92 | 96064 | 0.0000 | 0.0007 | 92 | 0.0000 |
| 37 | 37 | https://wandb.ai/z0r/ex-preppy/runs/clzdmfpg | 0.9480 | 92.7062 | 81 | 96064 | 0.0000 | 0.0000 | 81 | 0.0000 |
| 0 | 0 | https://wandb.ai/z0r/ex-preppy/runs/g9p5h6bw | 0.9366 | 52.4667 | 83 | 96064 | 0.0000 | 0.0005 | 83 | 0.0000 |
from typing import cast

from mini.data import load_checkpoint_from_volume

best_run = results[cast(int, non_dominated['score'].idxmax())]
log.info(f'Loading checkpoint of best run: seed={best_run.seed}, score={best_run.score:.4f} @ {best_run.url}')
model = CNColorMLP(K, n_nonlinear=N)
model = load_checkpoint_from_volume(model, volume, best_run.checkpoint_key)
I 324.2 no.2.10.1:Loading checkpoint of best run: seed=52, score=0.9769 @ https://wandb.ai/z0r/ex-preppy/runs/9wyfn37w
# # Generate a list of dimensions to visualize
# from itertools import combinations
# [
#     (
#         b,
#         a,
#         (a + 1) % 5 if (a + 1) % 5 not in (a, b) else (a + 2) % 5,
#     )
#     for a, b in combinations((0, 1, 2, 3, 4), 2)
# ]
from ex_color.evaluation import TestSet

test_set = TestSet.create()
from IPython.display import clear_output

baseline_results = test_set.evaluate(model, [], tags={'baseline'})
clear_output()

viz.plot_cube(baseline_results)
# viz.plot_recon_loss(baseline_results)
# viz.plot_latent_space(
#     baseline_results,
#     dims=[(1, 0, 2), (2, 0, 1), (3, 0, 1), (4, 1, 2), (3, 2, 4), (4, 3, 0)],
# )

from IPython.display import clear_output
from ex_color.surgery import ablate

ablated_model = ablate(model, 'bottleneck', [0])
ablation_results = test_set.evaluate(ablated_model, [], tags={'ablated'})
clear_output()

viz.plot_cube(ablation_results)
# viz.plot_recon_loss(ablation_results)
# viz.plot_latent_space(
#     ablation_results,
#     dims=[(1, 0, 2), (2, 0, 1), (3, 0, 1), (4, 1, 2), (3, 2, 4), (4, 3, 0)],
# )

from IPython.display import clear_output

from ex_color.surgery import prune

pruned_model = prune(model, 'bottleneck', [0])
pruned_results = test_set.evaluate(pruned_model, [], tags={'pruned'})
clear_output()

viz.plot_cube(pruned_results)
# viz.plot_recon_loss(pruned_results)
# viz.plot_latent_space(
#     pruned_results,
#     dims=[(0, None, 1), (1, None, 0), (2, None, 0), (3, 0, 1), (2, 1, 3), (3, 2, None)],
# )

from math import cos, radians
from IPython.display import clear_output

from ex_color.intervention import Suppression, BoundedFalloff, InterventionConfig


falloff = BoundedFalloff(
    cos(radians(90)),  # cos(max_angle)
    1,  # completely squash fully-aligned vectors
    # 2,  # soft rim, sharp hub
    0,
)
suppression = InterventionConfig(
    apply=Suppression(torch.tensor(RED), falloff),
    layer_affinities=['bottleneck'],
)
suppression_results = test_set.evaluate(model, [suppression], tags={'suppression'})
clear_output()

viz.plot_cube(suppression_results)
# viz.plot_recon_loss(suppression_results)
# viz.plot_latent_space(
#     suppression_results,
#     dims=[(1, 0, 2), (2, 0, 1), (3, 0, 1), (4, 1, 2), (3, 2, 4), (4, 3, 0)],
# )

import numpy as np
from ex_color.vis.helpers import ThemedAnnotation


max_error = np.max(
    [
        baseline_results.loss_cube['MSE'],
        ablation_results.loss_cube['MSE'],
        pruned_results.loss_cube['MSE'],
    ]
)

print('Baseline')
viz.plot_stacked_results(
    baseline_results,
    latent_dims=((3, 0, 1), (3, 2, 4)),
    max_error=max_error,
)

print('Ablation')
viz.plot_stacked_results(
    ablation_results,
    latent_dims=((3, 0, 1), (3, 2, 4)),
    max_error=max_error,
)

print('Pruned')
viz.plot_stacked_results(
    pruned_results,
    latent_dims=((2, None, 0), (2, 1, 3)),
    max_error=max_error,
)

print('Suppression')
viz.plot_stacked_results(
    suppression_results,
    latent_dims=((3, 0, 1), (3, 2, 0)),
    # latent_dims=((1, 0, 2), (1, 2, 0)),
    max_error=max_error,
    latent_annotations=[
        ThemedAnnotation(direction=RED, angle=2 * (np.pi / 2 - falloff.a), dashed=True),
    ],
)
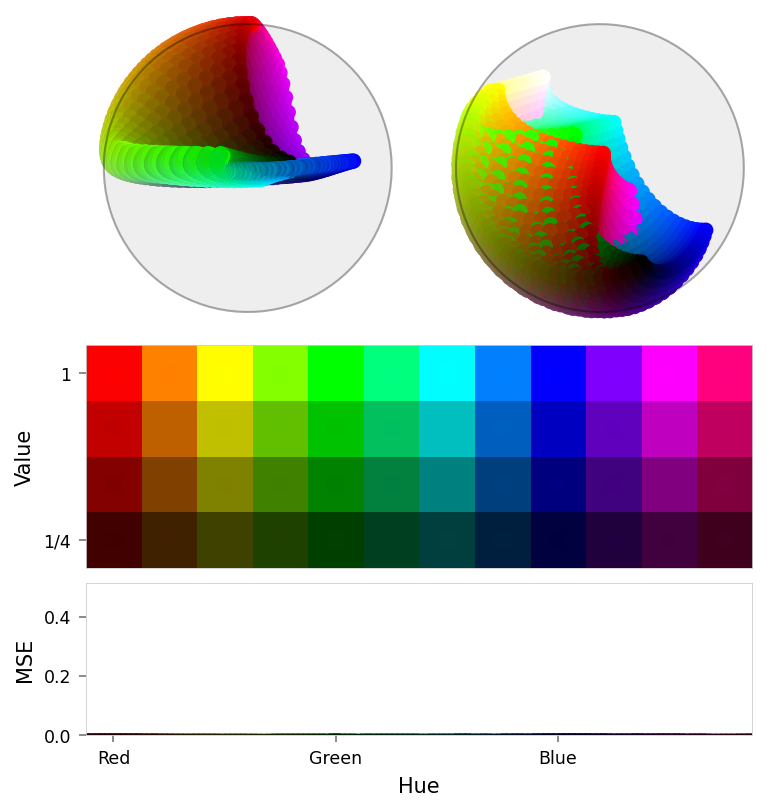
Baseline
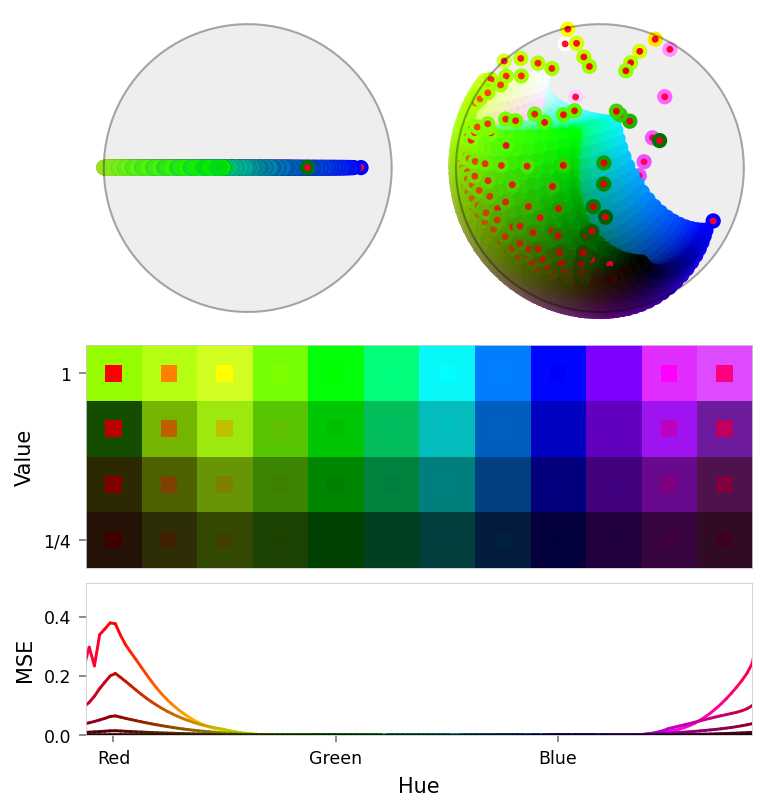
Ablation
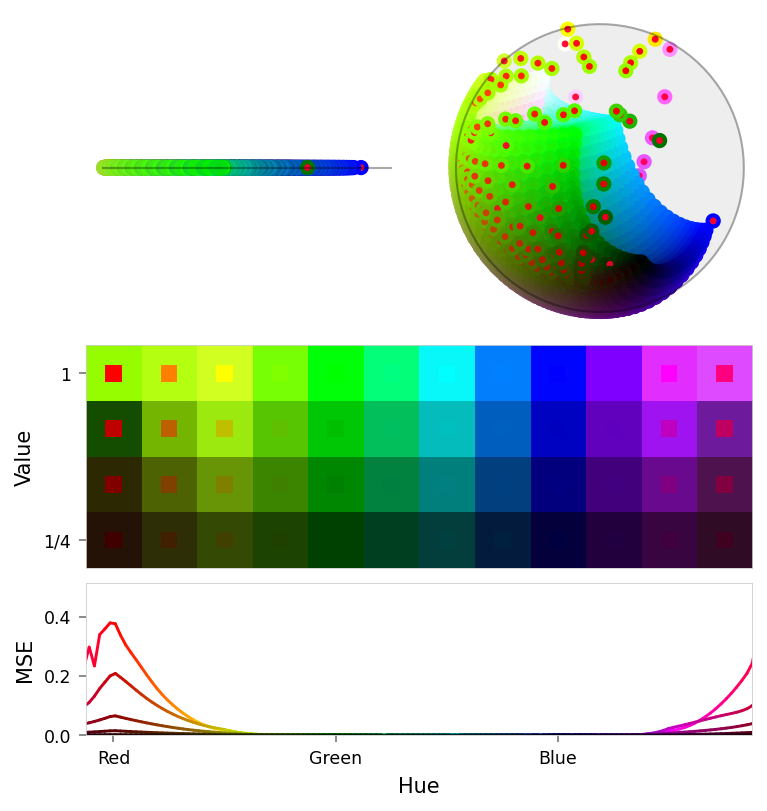
Pruned
Suppression
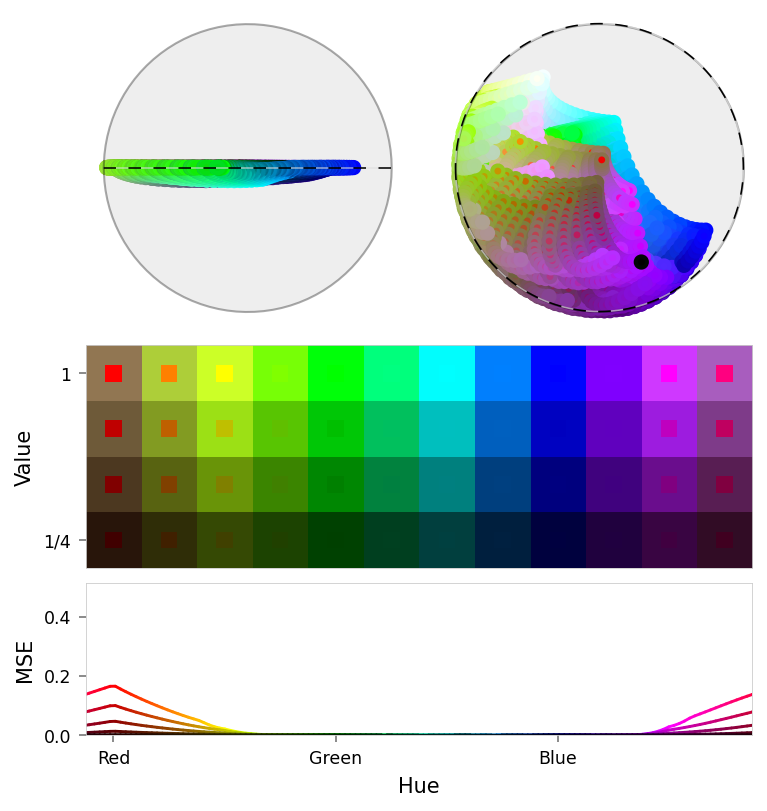
viz.tab_error_vs_color(baseline_results, ablation_results, pruned_results, suppression_results)
viz.tab_error_vs_color_latex(baseline_results, ablation_results, pruned_results, suppression_results)
| Name | RGB | Baseline | Ablated | Δ Abl | Pruned | Δ Pru | Suppression | Δ Sup |
|---|---|---|---|---|---|---|---|---|
| red | 0.000 | 0.385 | +0.385 | 0.385 | +0.385 | 0.169 | +0.169 | |
| orange | 0.000 | 0.113 | +0.113 | 0.113 | +0.113 | 0.083 | +0.083 | |
| yellow | 0.000 | 0.017 | +0.017 | 0.017 | +0.017 | 0.021 | +0.021 | |
| lime | 0.000 | 0.001 | +0.000 | 0.001 | +0.000 | 0.001 | +0.000 | |
| green | 0.000 | 0.000 | +0.000 | 0.000 | +0.000 | 0.000 | +0.000 | |
| teal | 0.000 | 0.000 | +0.000 | 0.000 | +0.000 | 0.000 | +0.000 | |
| cyan | 0.000 | 0.001 | +0.001 | 0.001 | +0.001 | 0.000 | +0.000 | |
| azure | 0.000 | 0.000 | +0.000 | 0.000 | +0.000 | 0.000 | +0.000 | |
| blue | 0.000 | 0.000 | +0.000 | 0.000 | +0.000 | 0.000 | +0.000 | |
| purple | 0.000 | 0.000 | -0.000 | 0.000 | -0.000 | 0.000 | -0.000 | |
| magenta | 0.000 | 0.015 | +0.015 | 0.015 | +0.015 | 0.028 | +0.028 | |
| pink | 0.000 | 0.117 | +0.117 | 0.117 | +0.117 | 0.104 | +0.104 | |
| black | 0.000 | 0.000 | +0.000 | 0.000 | +0.000 | 0.000 | +0.000 | |
| dark gray | 0.000 | 0.000 | +0.000 | 0.000 | +0.000 | 0.000 | +0.000 | |
| gray | 0.000 | 0.000 | +0.000 | 0.000 | +0.000 | 0.000 | +0.000 | |
| light gray | 0.000 | 0.000 | +0.000 | 0.000 | +0.000 | 0.000 | +0.000 | |
| white | 0.000 | 0.000 | +0.000 | 0.000 | +0.000 | 0.000 | +0.000 |
\begin{table}
\centering
\label{tab:placeholder}
\caption{Reconstruction error by color and intervention method}
\sisetup{
    round-mode = places,
    round-precision = 3,
    table-auto-round = true,
    % drop-zero-decimal = true,
}
\begin{tabular}{l c g g g g}
\toprule
\multicolumn{2}{c}{{Color}} & \multicolumn{1}{c}{{Baseline}} & \multicolumn{1}{c}{{Ab}} & \multicolumn{1}{c}{{Prun}} & \multicolumn{1}{c}{{Suppression}} \\
\midrule
Red        & \swatch{FF0000} &  0.000077906 &  0.384716421 &  0.384716421 &  0.168523297 \\
Orange     & \swatch{FF7F00} &  0.000031726 &  0.113451622 &  0.113451622 &  0.083263777 \\
Yellow     & \swatch{FFFF00} &  0.000013345 &  0.016918859 &  0.016918859 &  0.020894140 \\
Lime       & \swatch{7FFF00} &  0.000079475 &  0.000485919 &  0.000485919 &  0.000494194 \\
Green      & \swatch{00FF00} &  0.000000000 &  0.000472142 &  0.000472142 &  0.000497808 \\
Teal       & \swatch{00FF7F} &  0.000053029 &  0.000196097 &  0.000196097 &  0.000000000 \\
Cyan       & \swatch{00FFFF} &  0.000032129 &  0.000706011 &  0.000706011 &  0.000000000 \\
Azure      & \swatch{007FFF} &  0.000013463 &  0.000026407 &  0.000026407 &  0.000000000 \\
Blue       & \swatch{0000FF} &  0.000072361 &  0.000084369 &  0.000084369 &  0.000087863 \\
Purple     & \swatch{7F00FF} &  0.000014799 & -0.000009592 & -0.000009592 & -0.000009529 \\
Magenta    & \swatch{FF00FF} &  0.000021298 &  0.014621931 &  0.014621931 &  0.028397223 \\
Pink       & \swatch{FF007F} &  0.000011701 &  0.117298670 &  0.117298670 &  0.103648156 \\
Black      & \swatch{000000} &  0.000056622 &  0.000151883 &  0.000151883 &  0.000155355 \\
Dark gray  & \swatch{3F3F3F} &  0.000022615 &  0.000145711 &  0.000145711 &  0.000000000 \\
Gray       & \swatch{7F7F7F} &  0.000027212 &  0.000380780 &  0.000380780 &  0.000000000 \\
Light gray & \swatch{BFBFBF} &  0.000023661 &  0.000005613 &  0.000005613 &  0.000000000 \\
White      & \swatch{FFFFFF} &  0.000083601 &  0.000299237 &  0.000299237 &  0.000325033 \\
\bottomrule
\end{tabular}
\end{table}
viz.plot_error_vs_similarity(
    ablation_results,
    (0, 1, 1),
    anchor_name='red',
    power=3,
)

viz.plot_error_vs_similarity(
    pruned_results,
    (0, 1, 1),
    anchor_name='red',
    power=3,
)

viz.plot_error_vs_similarity(
    suppression_results,
    (0, 1, 1),
    anchor_name='red',
    power=2,
)
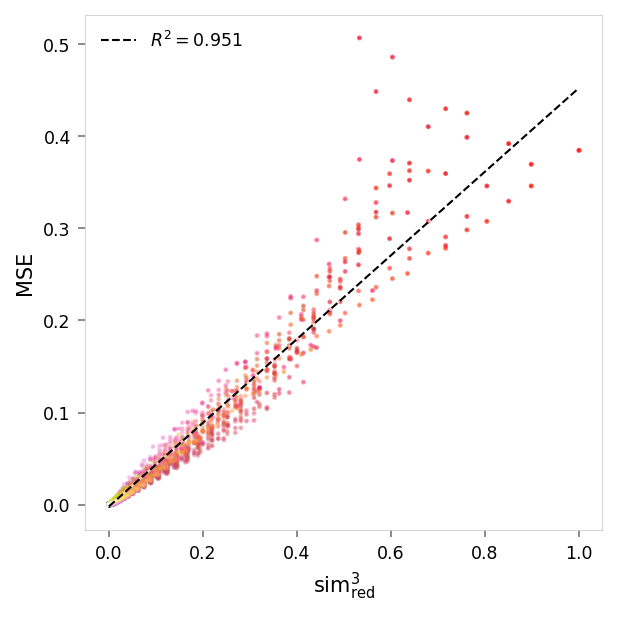
MSE,sim³ ablated: r = 0.98, R²: 0.95, p = 0
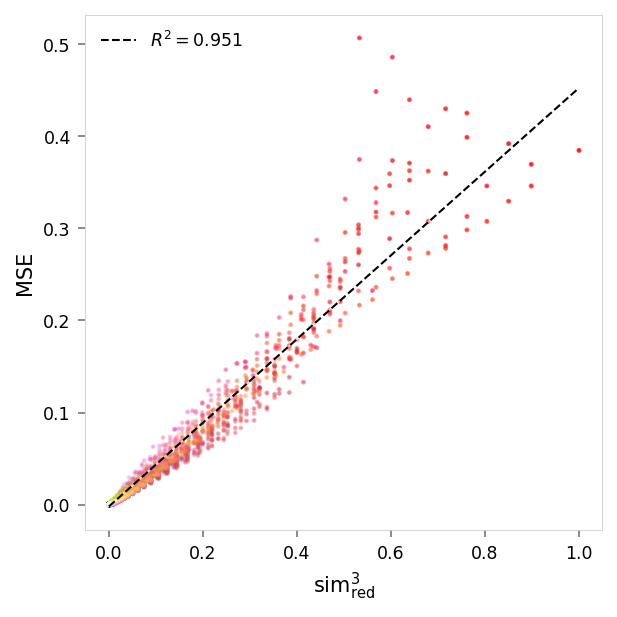
MSE,sim³ pruned: r = 0.98, R²: 0.95, p = 0
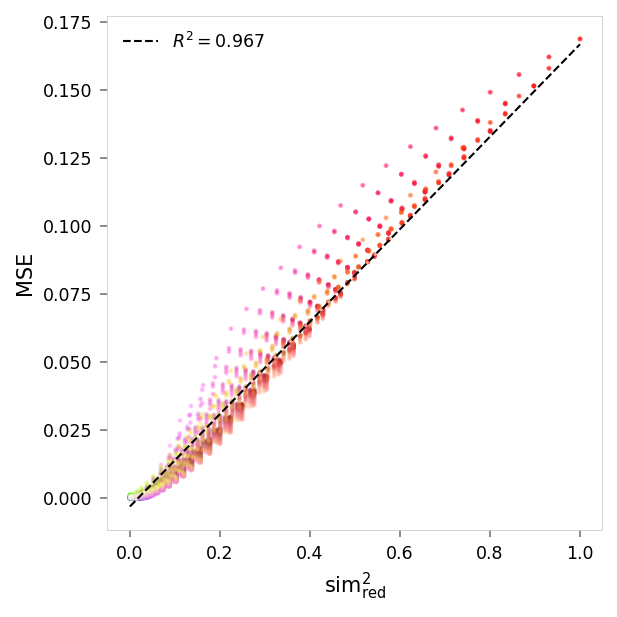
MSE,sim² suppression: r = 0.98, R²: 0.97, p = 0
